
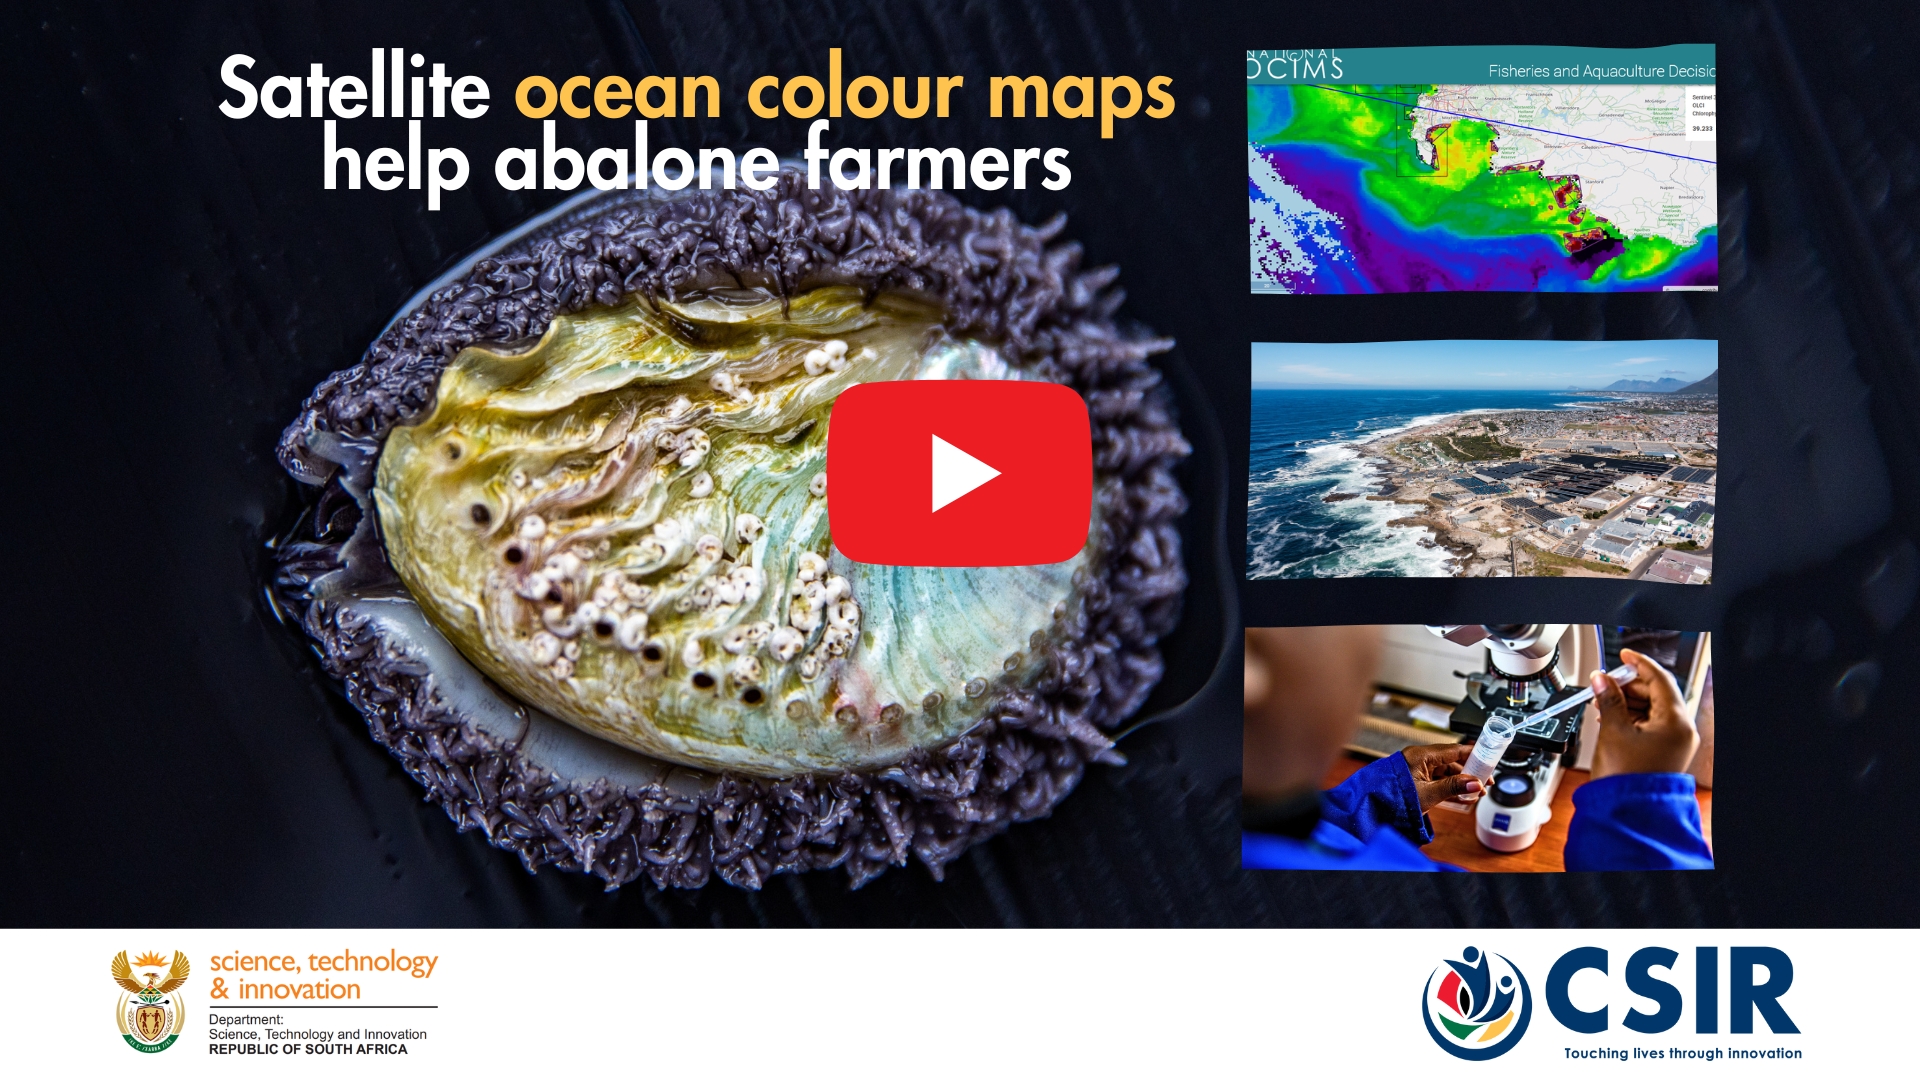
Satellite ocean colour maps warn abalone farmers of harmful algae
Abalone farmers along South Africa’s coast are now using ocean colour maps to track marine algal blooms that could harm their export molluscs. Scientists from the Council for Scientific and Industrial Research (CSIR) developed ocean colour and temperature data from satellites that is easy to access as an online tool. The work forms part of the country’s ocean economy plan to boost aquaculture jobs.
Abalone farmers along South Africa’s coast are now using ocean colour maps to track marine algal blooms that could harm their export molluscs. Scientists from the Council for Scientific and Industrial Research (CSIR) developed ocean colour and temperature data from satellites that is easy to access as an online tool. The work forms part of the country’s ocean economy plan to boost aquaculture jobs.
The CSIR’s Dr Marié Smith, a marine Earth observation expert, says the combination of upwelling, followed by calm conditions or marine heatwaves, can cause microscopic algae to proliferate. Abalone can be sensitive to certain species of bloom-forming algae.
Sarah Halse, Research and Sustainability Manager at Abagold, an aquaculture facility in Walker Bay, Hermanus says, “There are different mechanisms of harmful algal blooms - some cause toxins, and some toxins are harmful to certain species but not to others. Some blooms are harmful in that they cause mechanical damage - they might be spikey and stick in fish gills, for instance.”
Red tides are not new; an abalone farm’s scientific team will routinely check for signs of harmful algae in incoming seawater. But now, it is possible to use ocean colour maps from satellite data to track algal blooms before they even reach an aquaculture facility.
“The nice thing about satellite information is that it provides you with a much larger spatial scale of information than you could get with simply taking a single sample at the farm at the intake pipe,” says Smith.
At Abagold, the roughly 400 staff tend to about 15 million of these animals, which grow through various stages of life in the very same seawater: intake pipes fill 5 000 tanks directly from the ocean below.
The younger abalone looks like tiny blue snails, clinging in bunches to specially designed black cone hideouts in tanks stationed nearest the waves below. Further up the farm mature molluscs bathe and crawl, pearlescent and heavy in the careful hands moving them from tank to tank.
Marius Hugo, Abagold’s COO, says the company’s biological stock has taken years to rebuild. “In 2017, we had an algal bloom that we were unprepared for. We had mortalities of about 40% in that year.”
Millions of abalone in the Walker Bay area were killed as phytoplankton numbers got out of hand, producing toxins that caused a harmful “red tide” throughout nearby bays.
Smith says that if the satellite imagery and tool had been available in 2017, abalone farmers would have had more time to take protective measures like closing their intake pipes, changing their filters and adjusting feeding schedules to preserve the water quality for their animals.
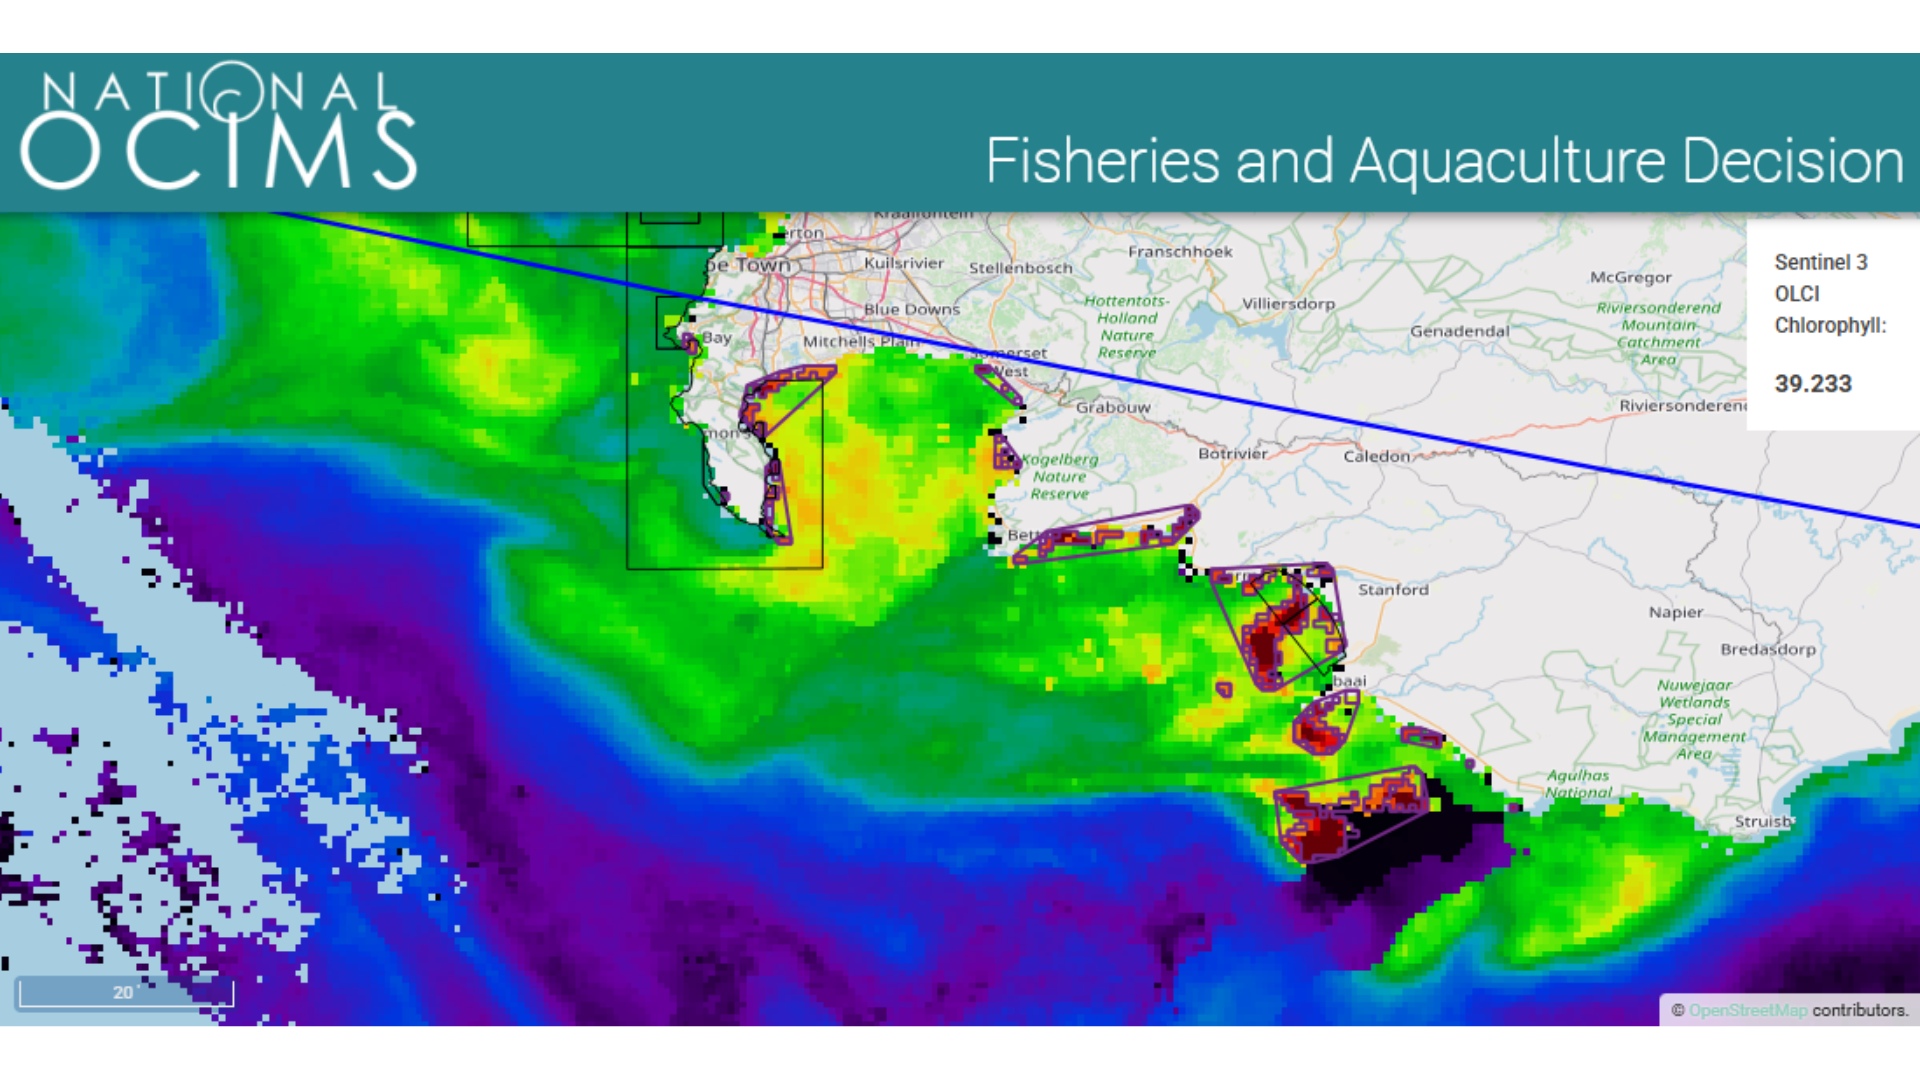
Smith is a lead expert behind the Fisheries and Aquaculture Decision Support Tool of the National Oceans and Coastal Information Management System (OCIMS). The free, easy-to-use tool interprets ocean colour and temperature data from the Copernicus Sentinel-3 polar-orbiting satellite so that abalone farmers can monitor approaching harmful red tides in near real time.
Hugo says Abagold and other aquaculture facilities nearby have since learnt to anticipate harmful algal blooms using the OCIMS tool, along with ongoing support from Smith and the CSIR.
“The aquaculture industry is really integrated in the community,” he says. “It’s a large provider, a driver of the economy and the small local economy. A lot of the jobs that were dependent on the fisheries and the ocean have transferred to the aquaculture sector,” he says.
Smith says past, present and future satellite data is critical to safeguard these jobs, particularly in the context of the climate crisis where frequent and intense environmental hazards like marine heatwaves could worsen red tides.
“In terms of climate change adaptation and being able to prepare for climate change impacts, satellite data are very valuable because the satellites have been up there for a long time,” she says.
This means ocean colour and temperature data trends can be analysed and used to model future scenarios. “We can see if there's more variable conditions or if the red tides have been increasing,” says Smith.
For more information, watch the video:
Photo/image captions
Picture 1: A screenshot of a CSIR-developed ocean colour map on the "Fisheries and Aquaculture Decision Support Tool" of the National Oceans and Coastal Information Management System (OCIMS). The free, easy-to-use tool interprets ocean colour and sea surface temperature data from the Copernicus Sentinel-3 polar-orbiting satellite so that abalone farmers can monitor approaching harmful red tides in near real time.
-ENDS-
Issued by CSIR Strategic Communication
For enquiries contact:
Phetolo Phatsibi,:CSIR Media Relations Practitioner
Email: PPhatsibi@csir.co.za
Mobile: 081 396 8871
Kulani Chauke: Media Relations Manager
Email: KChuake@csir.co.za
Mobile: 071 266 0019
About the CSIR:
The CSIR, an entity of the Ministry of Science, Technology and Innovation, is one of Africa’s leading organisations in scientific and technology research, development and implementation. Constituted by an Act of Parliament in 1945 as a science council, the CSIR undertakes directed and multidisciplinary research and technological innovation, as well as industrial and scientific development, to improve the quality of life of all South Africans.
This year, the CSIR celebrates 80 years of touching lives through innovation. For more information, visit www.csir.co.za
Follow us on social media:
X: @CSIR. Facebook: CSIRSouthAfrica. Instagram: CSIRSouthAfrica. LinkedIn: Council for Scientific and Industrial Research (CSIR). YouTube: CSIRNewMedia